WSU STAT 360
Class Session 9 Summary and Notes. October 27, 2000
Note: There are no new notes for this class session, but please go check the Statistics advisor which I put together in response to class concerns over how to choose a probability distribution to solve any particular problem.
Change of Syllabus
We have decided to alter the class structure according to the following items
Problem 4.7 done in excruciating detail
What we are given about the problem is as follows.
Part A asks us to form a hypothesis concerning the true mean of the process and test the hypothesis. I began this in class by stating that in hypothesis testing the recently sampled data takes center stage. We begin by forming two hypotheses. Vining expects us to use a two tailed test, but I'll examine both a two tailed test and a one tailed test, and contrast and compare the two.
Consider a two tailed test first. The nominal hypothesis is
H0: The true mean=5.6

and the alternative is

Ha: The true mean is not 5.6
We shall assume that Y follows a normal distribution and use the standard normal deviate Z=(Y-m)/s/sqrt(3), the null hypothesis is then...
Z025 < (Y-m)/s/sqrt(3) < Z975
I plan to leave all hypothesis stated in terms of the standard normal deviate. You can translate to the deviate of the problem (Y), but it is simpler to use Z because our tables are for Z. If we substitute 5.8 for Y, and use the appropriate values of Zx from the table on pages 456 and 457, then the null hypothesis becomes
-1.96 < 0.49 < 1.96
which is true and we thus accept the null hypothesis. In other words there is no evidence at the 5% significance level to believe that the true process mean is other than our target of 5.6
It seems, to me at least, that the two tailed test is a bit silly. We have just measured a sample and found a mean value of 5.8. We ought to be concerned that the true process mean is drifting upward, which means that we ought to apply a one-tailed test. I'll formulate the test hypotheses as follows...
H0: The true mean=5.6

and the alternative is

Ha: The true mean is greater than 5.6
Once again we shall assume that Y follows a normal distribution and use the standard normal deviate Z=(Y-m)/s/sqrt(3), the null hypothesis is then...
-Infinity < (Y-m)/s/sqrt(3) < Z95
I am only concerned with the upper tail of the distribution in this test because the possibility of the true process mean being less than the target is less consistent with the alternative. If we substitute 5.8 for Y, and use the appropriate values of Zx from the table on pages 456 and 457. Then the null hypothesis is
-Infinity < 0.49 < 1.65
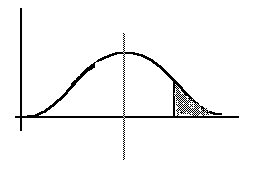
which is true and we thus accept the null hypothesis once again. In other words there is no evidence at the 5% significance level to believe that the true process mean is higher than our target of 5.6. However, notice that the one-tailed test has placed the rejection region closer to our sample value. In this sense it is a more conservative test. One final thought about this test is worthwhile. Figure 1, below, shows a sampling distribution centered on what we believe to be the current process mean, namely the target value of 5.6. The shaded region in the figure is the one-tailed rejection region and our hypothesis entails determining whether or not the sample mean has entered this region. If it has, we must conclude either that the nominal hypothesis is not true, and we reject it, or that a 1/20 chance occurence has lead us into making a Type I error.
Part B asks us to examine the confidence interval on the true mean of the process and make a judgement from it about the current process state. In using confidence intervals the likely value of process mean takes center stage. We begin by forming a symmetric, or two-tailed, confidence interval for the true process mean based on our recent sample mean.
Once again we shall assume that Y follows a normal distribution and use the standard normal deviate Z=(Y-m)/s/sqrt(3), the confidence interval is then...
Z025 < (Y-m)/s/sqrt(3) < Z975

Instead of leaving this in terms of standard normal deviate I'll transform back to physical units

Y-Z025s/sqrt(3) > m > Y-Z975s/sqrt(3)
If we substitute 5.8 for Y, and use the appropriate values of Zx from the table on pages 456 and 457, then the confidence interval on the process mean becomes
6.59 > 5.6 > 5.01
which is true. The confidence interval of process mean contains the target value of 5.6 at the 95% confidence level. In other words there is no evidence at the 95% confidence level to believe that the true process mean is other than our target of 5.6
Yet, once again if we are concerned about the process mean drifting upward it makes sense, at least to me, to use an asymmetric confidence interval.
Once again we shall assume that Y follows a normal distribution and use the standard normal deviate Z=.... Oh Gawd, must I write this again? Then the confidence interval on process mean is...
-Infinity < (Y-m)/s/sqrt(3) < Z95

And once again, instead of leaving this in terms of standard normal deviate I'll transform back to physical units

Infinity > m > Y-Z95s/sqrt(3)
The one sided confidence interval switched from -Infinity to +Infinity because of multiplying through the inequality by the minus sign in front of m. If we substitute 5.8 for Y, and use the appropriate values of Zx from the table on pages 456 and 457, then the confidence interval is
Infinity > 5.6 > 5.135
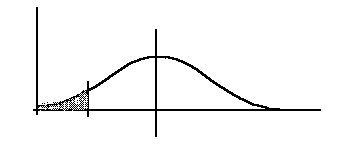
This inequality is true and the confidence interval contains the target mean. We conclude there is no evidence at the 95% confidence level to believe that the true process mean is higher than our target of 5.6. Notice once again that the asymmetric confidence interval is closer to our sample mean, and is a more conservative test. Figure 2 shows a sampling distribution centered on the current sample mean. The unshaded region is our asymmetric confidence region. If the target value lies within the shaded area we must conclude that either the current process mean has drifted away from the target, or that a 1/20 chance occurence is making it appear so. The sampling distribution in figure 2 is the same as the one in figure 1, and the analyses are mirror images of one another. Is it any wonder that we arrive at the same conclusions?
Part C asks us to rate the power of our test of significance in its ability to detect a change of process mean from the target value of 5.6 to 5.8. This is a small change considering that the standard error of the sample is 0.7/sqrt(3)=0.404, so we expect the power to be small.
The easiest way to think of the power measure is that it represents the probability of rejecting the nominal hypothesis when, in fact, the mean has drifted away from its nominal value. Of course, the power is related to how far the mean has drifted. We are powerless, so to speak, to detect small changes. I'll work this problem by examining power for both a two-tailed and one-tailed test.
We are going to calculate power for detecting a process mean that equals the sample mean of 5.8. The conditional probability statement is
Power = P(Reject H0 | process mean=5.8)
which translates in English to the probability of rejecting the nominal hypothesis knowing that the process mean equals 5.8. That is, power equals the probability of being correct.
In a two tailed test we reject the null hypothesis if Y < 4.81 or if Y > 6.39. (The reader can fill in the details from Part A.) Therefore, we find the above probability to be...
Power = {1-P( (6.39-5.8)/0.7/sqrt(3) )} + P( (4.81-5.8)/0.7/sqrt(3) )

or

Power = {1-P(1.46)}+P(-2.45) = {1-.9279}+.0071 = .0792
Indeed there is very little power in this test to detect a change in process mean as small as 0.2. Let me now examine the power of the one-tailed test. Here we reject the nominal hypothesis only if Y > 6.26. Thus,...
Power = {1-P( (6.26-5.8)/0.7/sqrt(3) )} = {1-P(1.14)} = 1-0.8729 = .13
The one-tailed test has nearly twice the power to detect a change in process mean of only 0.2. Of course, this increased power did not come to us for free. It has increased the likelihood of making a Type II error. The person testing the hypothesis has to decide what the ramifications of making Type I versus type II errors is and act accordingly.
Link forward to the next set of class notes for Friday, November 3, 2000