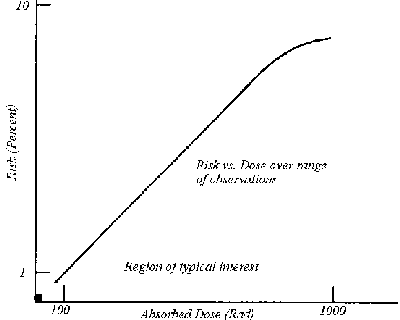
Figure 1. The risk vs. dosage relationship from observations. The range extends from 100 to 1000 Rad or so. However, the region of real interest is the tiny little box in the corner.
Sometimes we have to extend data to cover places in which no data were measured. For example, we try to predict what the demand for electric power will be in ten years in order to plan for new power plants, and all we have available is information about how demand has grown in the past ten years. We have to extrapolate our information into the future.
Extrapolation is prediction outside the range of our data; interpolation is prediction within the range. Both can be done badly for two common reasons. First, the model is wrong. Models are important to interpreting what we observe, both in science and in ordinary life. Data rarely speaks by itself, leaving it to a model to unify and explain the data.
Second, even if the model is not wrong there are probably hidden complications. It is possible to find a model that can explain the workings of some theory within the range of observations, but which has unknown, perhaps poor, reliability outside the range.
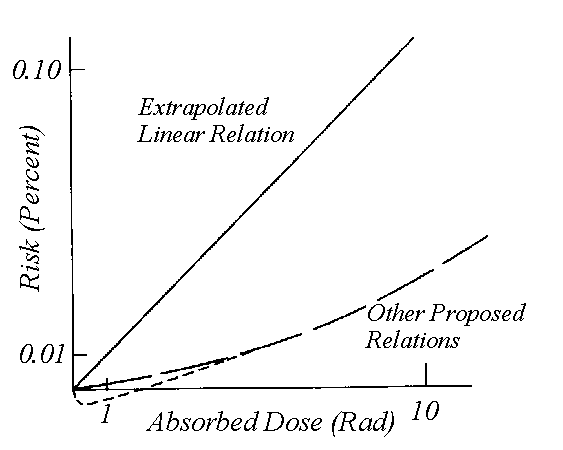
Both wrong models and hidden complications occur in calculating chemical and radiation risks. The commonly accepted model is that risk is proportional to dosage. If we look at radiation risk alone, we find evidence that risk is proportional to dosage. Figure 1, for example, shows risk versus dosage of ionizing radiation. The data come from accidents involving large doses of radiation. This presents a problem in that the range of observed dosage versus risk is unusual. We are interested mainly in the relationship down in the region of the little box in the corner of the graph. There is no way of knowing what the true relationship of dosage to risk is actually, but one model is that of a linear increase of risks with dosage beginning with the origin of the graph. It seems reasonable that zero dosage means zero risk, and, therefore, the curve must pass through the origin. However, this doesn't limit the range of possible relationships at all. People have proposed all sorts of alternative relationships in this region, as shown with dashed lines of Figure 2.

Figure 1. The risk vs. dosage relationship from observations. The range extends from 100 to 1000 Rad or so. However, the region of real interest is the tiny little box in the corner.
The linear assumption allows us to make calculations. For example, radiation dosage depends on the amount of uranium in the soil. Suppose that 50,000 people, approximately the population of Santa Fe, spend a year in that nice little town of Lusk, Wyoming that Microsoft promoted in its ads. Lusk has lots of uranium and radium in its soil, and residents there might absorb an additional 0.200 Rad per year. A general rule is that the added risk of cancer is 0.08% per Rad absorbed in a short period. If all of these assumptions are warranted then the additional cancers could be calculated as...
0.0008x0.200x50,000 = 8
So the group of 50,000 people would have an extra 8 cancers sometime during their collective lifetimes as a result of their extended visit to Lusk. Absorbed dose of cosmic radiation depends also on elevation, with the normal sea-level dosage (0.033 Rad/year) doubling for every 2000m. At one time Cheyenne Frontier Days (Cheyenne is approximately 2000m above sea level) was only 3 days long, now it is 10. If we imagine that 150,000 people attend the event each year, then the added cancer risk over the collective lifetimes off all these visitors over a century of Frontier Days is...
0.0008x0.033x7/365x(150,000)x100 = 8

Figure 2. This graph shows some proposed relationships of risk and dosage for the range of interest.
A similar model determines risk of cancer from synthetic chemicals. The standard method for doing this is to feed doses of these chemicals to surrogates and see how they react. The surrogates are generally rodentia, like guinea pigs and mice, and rats.
But we can't wait forever for the results of our test. We'd like to know in a couple of years if a chemical will produce cancer rather than wait 25 years or 30. Also, we would like the chemical, if it indeed is carcinogenic, to produce cancers in large enough proportion of our small test population, so we have a reasonable chance of observing it. The logistics of using 50,000 rodents in a test is unthinkable. So we give the rodents large doses of the chemical, perhaps 380,000 times the typical limit dosage that a person encounters.
We have to extrapolate dosages and their dangers 5 orders of magnitude to what humans typically encounter. This is a long extrapolation indeed. Moreover, we actually making a double extrapolation, because, unlike radiation dosage, where we have data from human studies, here we have to assume that rodents make good surrogates -- ones whose response to the chemical will mimick that of humans. The model may be doubly bad.
One defense of this predictive model is that it is our only alternative. Giving the chemical to humans in small doses, and waiting 25 years for a cancer epidemic, is no alternative at all. Despite some pleas to revise risk models to include risk thresholds, the prevailing opinion is still to use the linear model of risk.
"[I'd advise] caution against replacing one stupid model with another," said Ellen Silbergeld at the Cold Spring Harbor Meeting in 1990.
Even if the linear model is not "stupid." There are hidden complexities. Of the additional cancers caused by visits to Frontier Days--some folks get 'em and some don't. Individual response to an insult like radiation is so complex that no one can identify a specific case of harm even if we can say for certain that 8 extra cancers in 100 years result from it. However, attorneys and their clients will argue from now to eternity that proving something presents a risk of cancer means also that it caused my particular cancer.