The cheap instant coffee effect
Kevin T. Kilty
Physics at the Breakfast Table, the Klopsteg Memorial Lecture in the January issue of American Journal of Physics1, neglected to mention a breakfast table phenomenon that is easy to observe as follows.
Heat a cup of water to near its boiling point in a microwave. This leaves the water supersaturated with air, because nitrogen, oxygen, and other common gases in air are far more soluble in cold water than they are in hot water. Put instant coffee in the water and stir. The instant coffee granules provide nucleating sites for gas bubbles and soon the cup is full of foam. While it is in this foaming state, tap on the side of the cup with the spoon, or better yet with the wooden handle of a grapefruit knife, every second or so and listen. The pitch will rise with each tap on the cup. It will rise by at least an octave from the time the cup is full of foam until the time the foam clears which takes only 10-15 seconds.
I thought of naming this the cheap instant coffee effect, until I learned that it was already well known. Crawford2 dubbed it the hot chocolate effect; and, he cites a lecture in which Bragg3 might just as easily have called it the cold beer effect. I have observed the effect with hot chocolate mix, sugar in hot tea, salt in beer, and instant tea in cold water, as well as with instant coffee. Obviously the experiment is not limited to breakfast.
Crawford made a thorough study of the physics involved, and concluded that an increasing speed of sound in the liquid causes the rising pitch. His theory works like this. A charge of gas bubbles reduces the speed of sound in any liquid. This lowers the frequency of the fundamental mode of the liquid column, which determines the pitch. As foam clears in the coffee, the speed of sound rises and so does the pitch. Bragg, on the other hand, was more concerned with how sound quality changes as the foam clears.
Crawford’s study is extensive, but it is not the entire story. First, Crawford struck the cup on its bottom to produce only longitudinal modes. I struck the coffee cup on its side as it sat on the table, which set longitudinal, radial, and circumferential modes ringing. So, Crawford and the average breakfast eater aren’t doing the same experiment exactly.
Second, Crawford originally used an oscilloscope to examine the sound. I suppose that he measured only a few milliseconds of tone -- just enough to measure sound speed. The ear, however, has a settling time. It cannot perceive pitch unless a tone persists for some minimum duration. For example, a 100Hz tone must persist 0.04 seconds, or 4 cycles, before we discern its pitch. A tone of 1000Hz must persist for about 0.013 seconds, or for about 13 cycles. Lesser persistence sounds more like a click, scratch, static, or something, but not a pure tone.4 So, the pitch that an oscilloscope displays is not necessarily what an ear hears.
Third, the human ear does not always map fundamental mode of vibration to pitch uniquely5. Ambiguous tones can create the perception of a perpetual rise in pitch when there is no perpetual rise in fundamental mode, but only an adjustment of the harmonics. A person may even discern a fundamental when none is present.

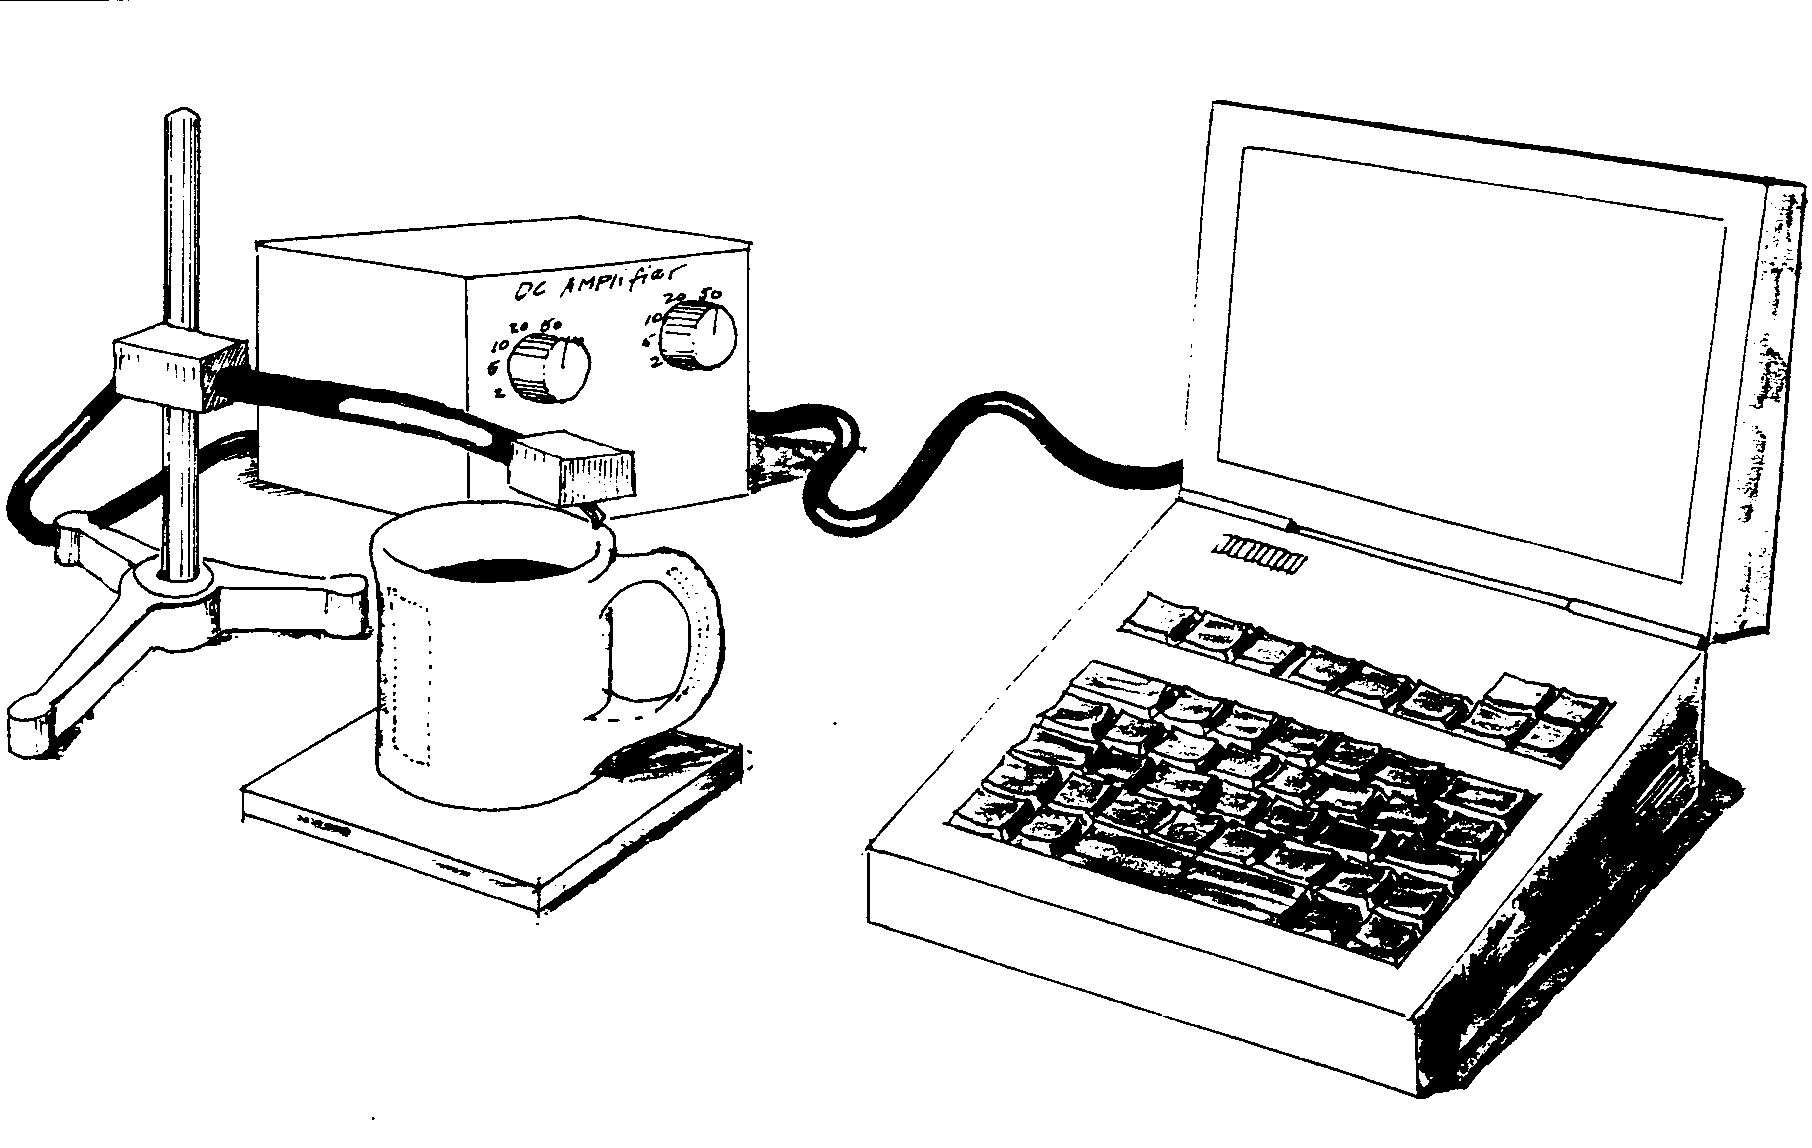
Figure 1. A tone arm picks up vibrations in the coffee cup which are amplified and fed to a dynamic signal analyzer.
For all of these reasons, I decided to investigate how the complete spectrum of vibrations in the cup changes as the foam clears and the apparent pitch rises. To gather data, I placed a scrap magnetic cartridge and tone arm on the cup, and fed its output through a DC amplifier to a data acquisition system. Figure 1 shows the set-up. I recorded three time-series; one while the coffee was fully charged with bubbles, one at an intermediate time, and the last when the foam had cleared. Then I drank the experiment while I computed spectra6.
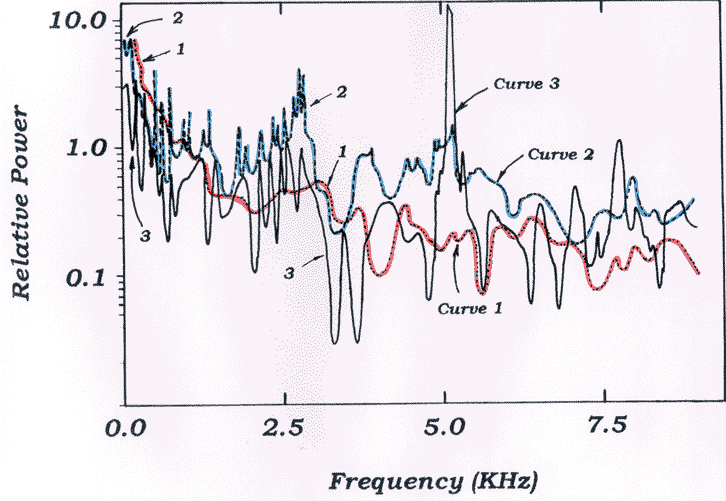
Figure 2 shows the spectrum in all three instances. With coffee foam stirred throughout the cup the sound had a dull, leaden quality. The red curve shows a spectrum with most of its energy concentrated at low frequency (1000Hz and below) falling off as e-f . I have no idea how a person evaluates pitch in such a situation. Obviously someone could perform valuable research by synthesizing sound from this type of spectrum and trying to characterize its pitch. There is also a broad series of peaks near 2500Hz on the red curve, but they have low amplitude and do not contribute much to the sound.

Figure 2. Vibration spectrum as recorded at three different times. Curve 1 shows the spectrum when the coffee is charged with foam and produces a dull leaden sound. Curve 2 pertains as the coffee is partially cleared. Curve 3 corresponds to a fully cleared coffee cup and a clear ringing sound.
As the foam clears the sound obtains a slight ringing quality. It’s dull still, but a person can begin to identify a pitch. The blue curve shows the spectrum has less energy at low frequency and what remains are distinct peaks. The peaks near 2500Hz have increased in magnitude, and there is a broad peak near 5000Hz, which seems to have risen from nowhere. If an increase in speed of sound alone causes pitch to rise, then features in the red curve should expand upward in frequency. The blue curve shows little evidence of this. Thomas Means and Peter Baum have both suggested that a changing speed of sound might also tune vibrations in the coffee to modes of vibration in the cup, and this could cause peaks to change amplitude as they shift7. This is a potentially confounding factor in this experiment.
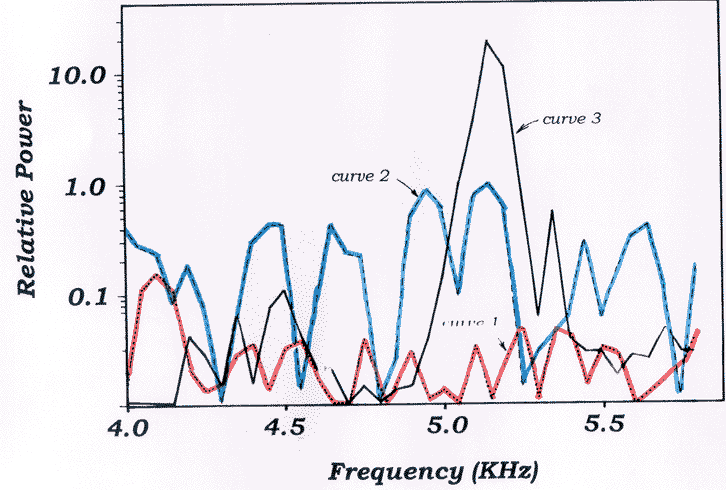
When the foam clears completely the sound has a distinct ring with high pitch. The black curve shows a spectrum with series of peaks. There is little energy left below 1000Hz. The peak near 5000Hz has grown in magnitude by a factor of twenty and a new peak has appeared near 7500Hz8. Once again, simply expanding the blue curve doesn’t produce the black curve. Figure 3 shows a detailed view of the peak at 5000Hz. The growth of this peak implies a lessening of sound absorption as the foam clears. The half power width of this peak is 100Hz approximately.
This half power width makes it possible for me to estimate the quality factor, Q, of the coffee for this vibration9. Quality factor (Q) measures how a vibration persists once its cause is removed. You can think of Q as representing the inverse of the fraction of energy that a vibration loses in each cycle. Q also measures spectral purity of a tone, which is the same as measuring how well tuned the system is to tones of this frequency. I calculate Q in the standard manner by dividing the central frequency of a peak by its width at its half-power level. The Q factor for this 5000Hz vibration in the coffee is then 50, whereas it is much lower for any feature present in the red curve. An increasing Q allows vibrations to persist long enough for the ear to hear them, and also for the analyzer to resolve them. What causes Q to change? Presumably it is the clearing charge of gas bubbles in the coffee. The small bubbles scatter and attenuate sound.

Figure 3. Shows detail of figure 2 in the range from 4kHz to 6kHz. The peak just above 5kHz dominates the vibrations when the coffee clears, but is not so dominate at earlier times.
Crawford is correct that increasing the speed of sound causes pitch to rise. However, without an increase in Q neither the analyzer nor the ear would ever detect it. Bragg’s observation about the changing quality of sound seems equally important in explaining the effect. Finally, there is probably an interaction between the coffee and the cup which deserves further study.
References and Notes
1/ Nagel, Sydney R. 1999. Am. J. Phys., 67, 17-25.
2/ Crawford, Frank S. 1982. Am. J. Phys., 50, 398-404.
3/ Bragg. W. 1968. The world of sound. Dover.
4/Everest, F.A. 1994. The Master Handbook of Acoustics. McGraw-Hill, 3rd Ed.
5/ Deutsch, D. 1992. Sci. Am. 267, 88-97. See also the web page
www.cameron.edu/~lloydd/webdoc1.html for sample sound files.6/ An example of the Burg algorithm, which I used to calculate spectra, is available in John Claerbout, Fundamentals of Geophysical Data Processing (McGraw-Hill, 1976). I smoothed these spectra below the 1.0 reference level to eliminate many spectral peaks that were insignificant but potentially confusing.
7/ The coffee cup and coffee are two separate vibrating systems, each with its own set of normal modes. If we think of one (the cup for instance) driving the other (the coffee), then the varying sound speed in the coffee may act to temporarily tune it to resonance with the cup. This would momentarily cause some component of the spectrum to change amplitude.
8/ I have tentatively identified the spectral peak near 5000Hz as the fundamental longitudinal mode, and that near 7500Hz as the fundamental radial mode. The peak near 2500Hz might be the fundamental circumferential mode, which is an interaction between the cup and the coffee.
9/ Pain, H.J. 1993. The physics of vibrations and waves. Wiley.
10/ A list of further experiments to perform for anyone who may be interested.
11/ Thomas Means and Peter Baum both made comments and suggestions which have helped improve this paper. I thank them.